02 | Analysis Of The Context Changes: Ecosystem
November 5th, 2009 by bruno boutotNow we are trying to visualize two factors of the Web that change the traditional-media environment: the speed of two-way communications, and the integration into one ecosystem of all the exchanges that are part of making a mass media. #
figure 5: Acceleration of all communications #
Observations on figure 5 #
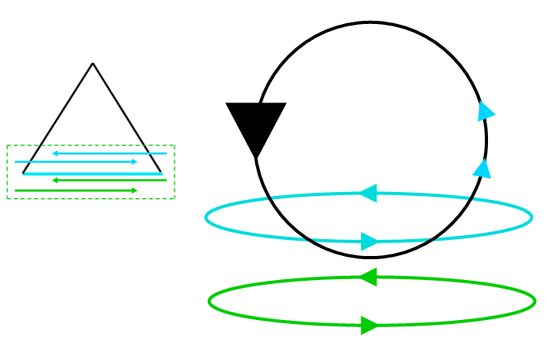
Once again: this is not intended to reflect reality, just a figurative way to grasp the changes of context. To visualize the effects of the new speed of communication brought by the Web, we tweak our triangle in figure 3 into circles representing continuous exchanges : #
- Black arrow, down: media to users (the usual content provided by the media).
- Blue arrows, up: users to media (readers mail, comments).
- Blue arrows, left and right: exchanges between users within the media (forums, comments).
- Green arrows: exchanges between our users outside of the media (flickr, facebook, Twitter: the whole Web).
These curves will be used in the next diagrams in the same way: to represent very fast communications within relationships. #
figure 6: Content exchanges with speed #
Observations on figure 6 #
We are talking as media people and we continue to look at the situation from a media-centric point of view (for now). #
- In figure 4, we have placed the media at the middle of two opposites triangles: the top one showing the sources (basically the whole world) concentrating into the media, the bottom one from the media to the public (blue line).
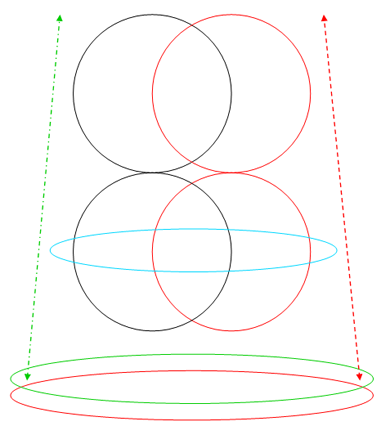
- Now we are combining the triangles of figure 3 with the circles of figure 5, showing a series of flowing exchanges:
- Top black circle: exchanges of the editorial department with online sources: content that we get, content that we give (a part of which Jeff Jarvis named “The link economy”).
- Lower black circle: exchanges with readers; content that we send to them and content that they send to us.
- Blue ellipse: content that readers exchange between themselves within our media.
- Green ellipse: content that our readers exchange outside of the media.
- Green arrows: here we introduce a new phenomenon brought by the Web ecosystem: content that our readers exchange directly with our sources (news agencies, weather, sports franchises, news search, etc.).
figure 7: All exchanges with speed #
Observations on figure 7 #
To complete the picture, we just add, in red, the flows of money: #
- Top red circle: exchanges between the media and its advertisers.
- Lower red circles: exchanges between the media and its readers.
- Lower red ellipse: business between our users outside of the media.
- Red arrows: direct business between our users and our advertisers who have e-commerce sites.
We could also add more details in each of the 9 flows of exchanges, but for now let’s keep this “simple”. #
figure 8: The dangers: the media is bypassed and marginalized #
Observations on figure 8 #
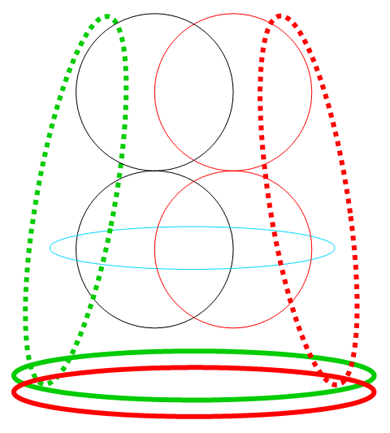
Here we see the dangers that threaten the traditional relationship between mass media and their users: all these new forces present in the ecosystem begin to take the users away from the media. #
- Green vertical (dotted) ellipse: our users establish direct and growing exchanges with content sources.
- Red vertical (dotted) ellipse: our users establish direct and growing business exchanges with advertisers and merchants.
- Green and red horizontal ellipses at the bottom: our users expand their exchanges among themselves outside of the media, for content (green) as well as for business (red).
- the content of the media is marginalized because the users have growing exchanges with the content sources and between themselves (green ellipses).
- the attention business that the media did with its users and its advertisers is bypassed by the direct exchanges between advertisers and users (red dotted ellipse).
- the business that the media did with users within the media (classifieds) is bypassed by users doing business directly between themselves outside of the media (red horizontal ellipse).
figure 9: The solutions: the media has to strengthen all its exchanges
#
Observations on figure 9 #
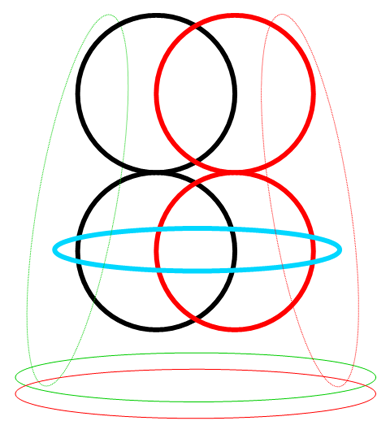
This simple graph shows that the only way for the media to survive this hemorrhage is to strengthen all exchanges opposing the forces shown in figure 8: #
- Top black circle: content exchanges with sources.
- Lower black circle: content exchanges with users.
- Top red circles: business exchanges with advertisers.
- Lower red circle: business exchanges with readers.
- Blue ellipse: content exchanges between users within the media.
This can also be used as a template against which we can measure all our business model experiments: our survival as media depends on finding ways to stabilize relationships using two-way communications in an ever-accelerating environment. #
Interesting. #




November 13th, 2009 at 6:07 pm
[…] HOW « 02 | Analysis Of The Context Changes: Ecosystem […]
November 15th, 2009 at 12:26 pm
Awesome read. Everything is up-to-date on my side of this too. :wink: